Loading...
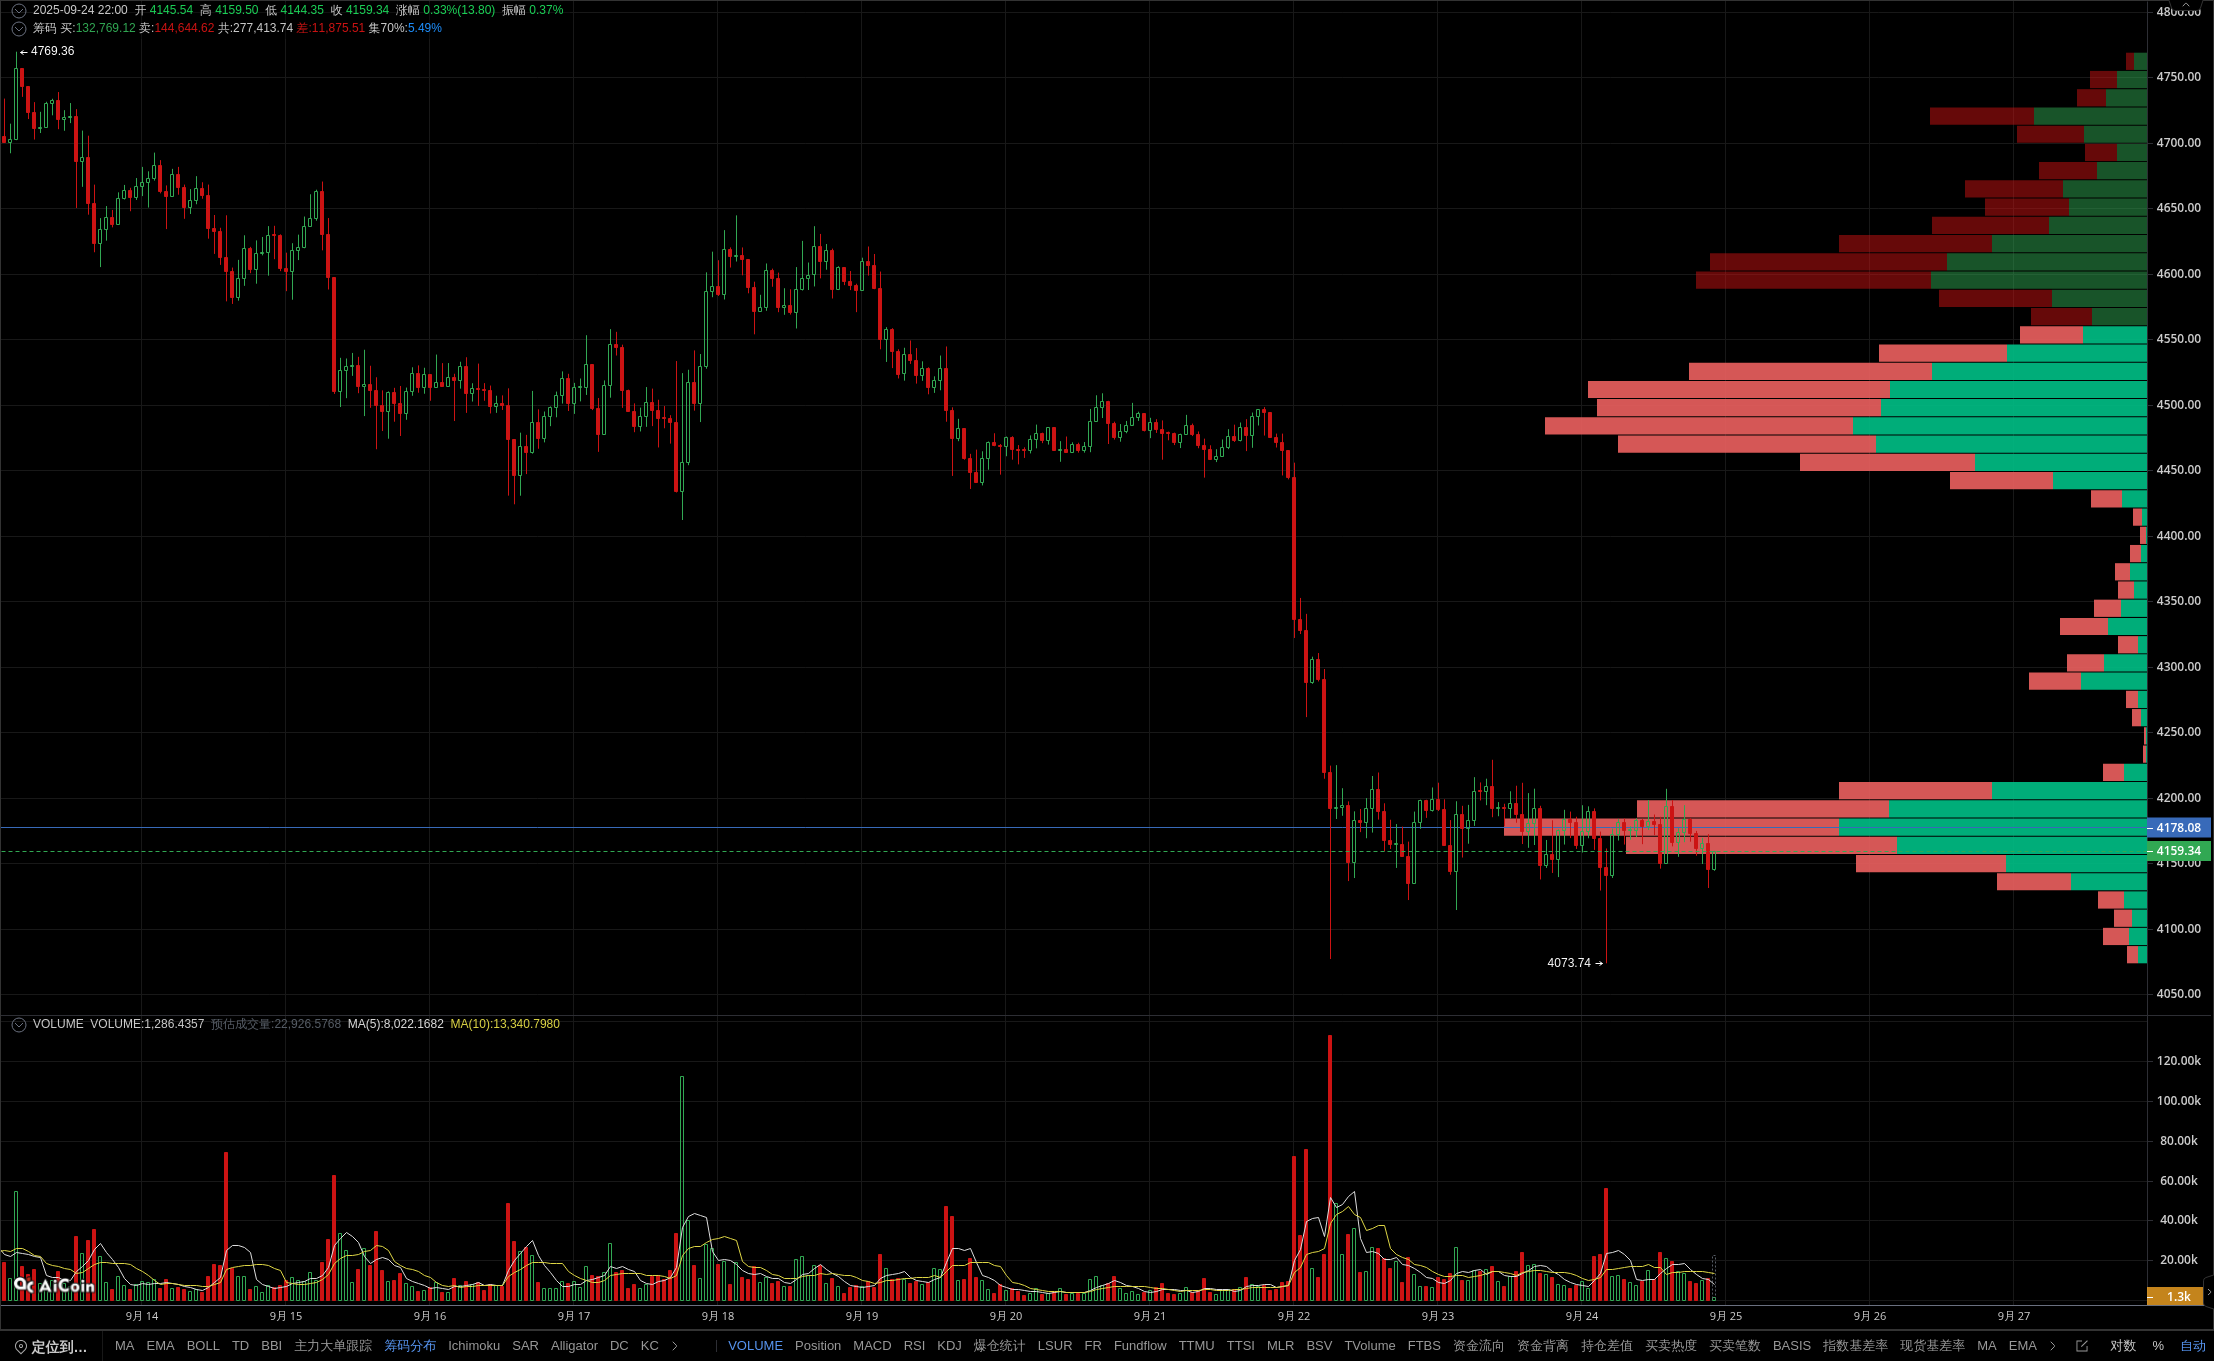
ETH is under short-term pressure, pay attention to the resistance of 4178
--
Member indicators show that the current price is below the EMA24/52 moving average and a dead cross below the MACD zero axis, indicating a strong bearish signal. Based on the distribution of chips, the trading volume in the 4178.5 resistance zone accounts for 6.93%, indicating weak buying power and further verifying the upward pressure. On the candlestick chart, the 1-hour cycle top pattern is established, and with the weak rebound of RSI double bottom, it may continue to decline in the short term. Support attention around 4144, if it falls below, it may accelerate the downward trend. Open membership and accurately capture trend reversal signals! The data is sourced from the PRO member's [ETH/USDT Binance 1-hour] K-line, for reference only, and does not constitute any investment advice.